Much of the discussion on this blog has focused on how we will
control computerized devices in the future. Going back to the original post,
this has been a focus on transforming the keyboard and mouse/trackpad. But,
there is another important facet of the interaction – the communication is
two-way and people have to be able to receive information as well.

The old CRT monitors gave way to the LCD flat panel and the
touch screen. We may soon see such advances as flexible screens, displays on
glasses, and portable projection onto any available surface in common use.
But, no matter how the display hardware changes, we will still
need to innovate ways to show the increasingly complex relationships that
emerge from our data.
 |
| Mendeleev's original periodic table (from 1869) was such a ground-breaking and insightful display of a very complex subject that it was used to predict the existence and characteristics of undiscovered elements. |
 |
| A more modern example from 2006 uses color gradients to make population changes pop out. |
As computing power and storage capacity have surged, we now have
the ability to address enormous data sets and seek out the often-hidden
connections that pervade our world.
These networks are driving innovation and insight, but they are
often totally opaque. How can we make them perceptible in such a way that we
can identify the key linkages and, especially, the non-intuitive structures
that these big data analytics bring to light?
One of more common new visualizations for public consumption is
the word cloud. A common form uses font size to reflect how often a term appears,
allowing patterns to emerge more clearly.
 |
| Taken from the Many Eyes software projected developed by IBM. |
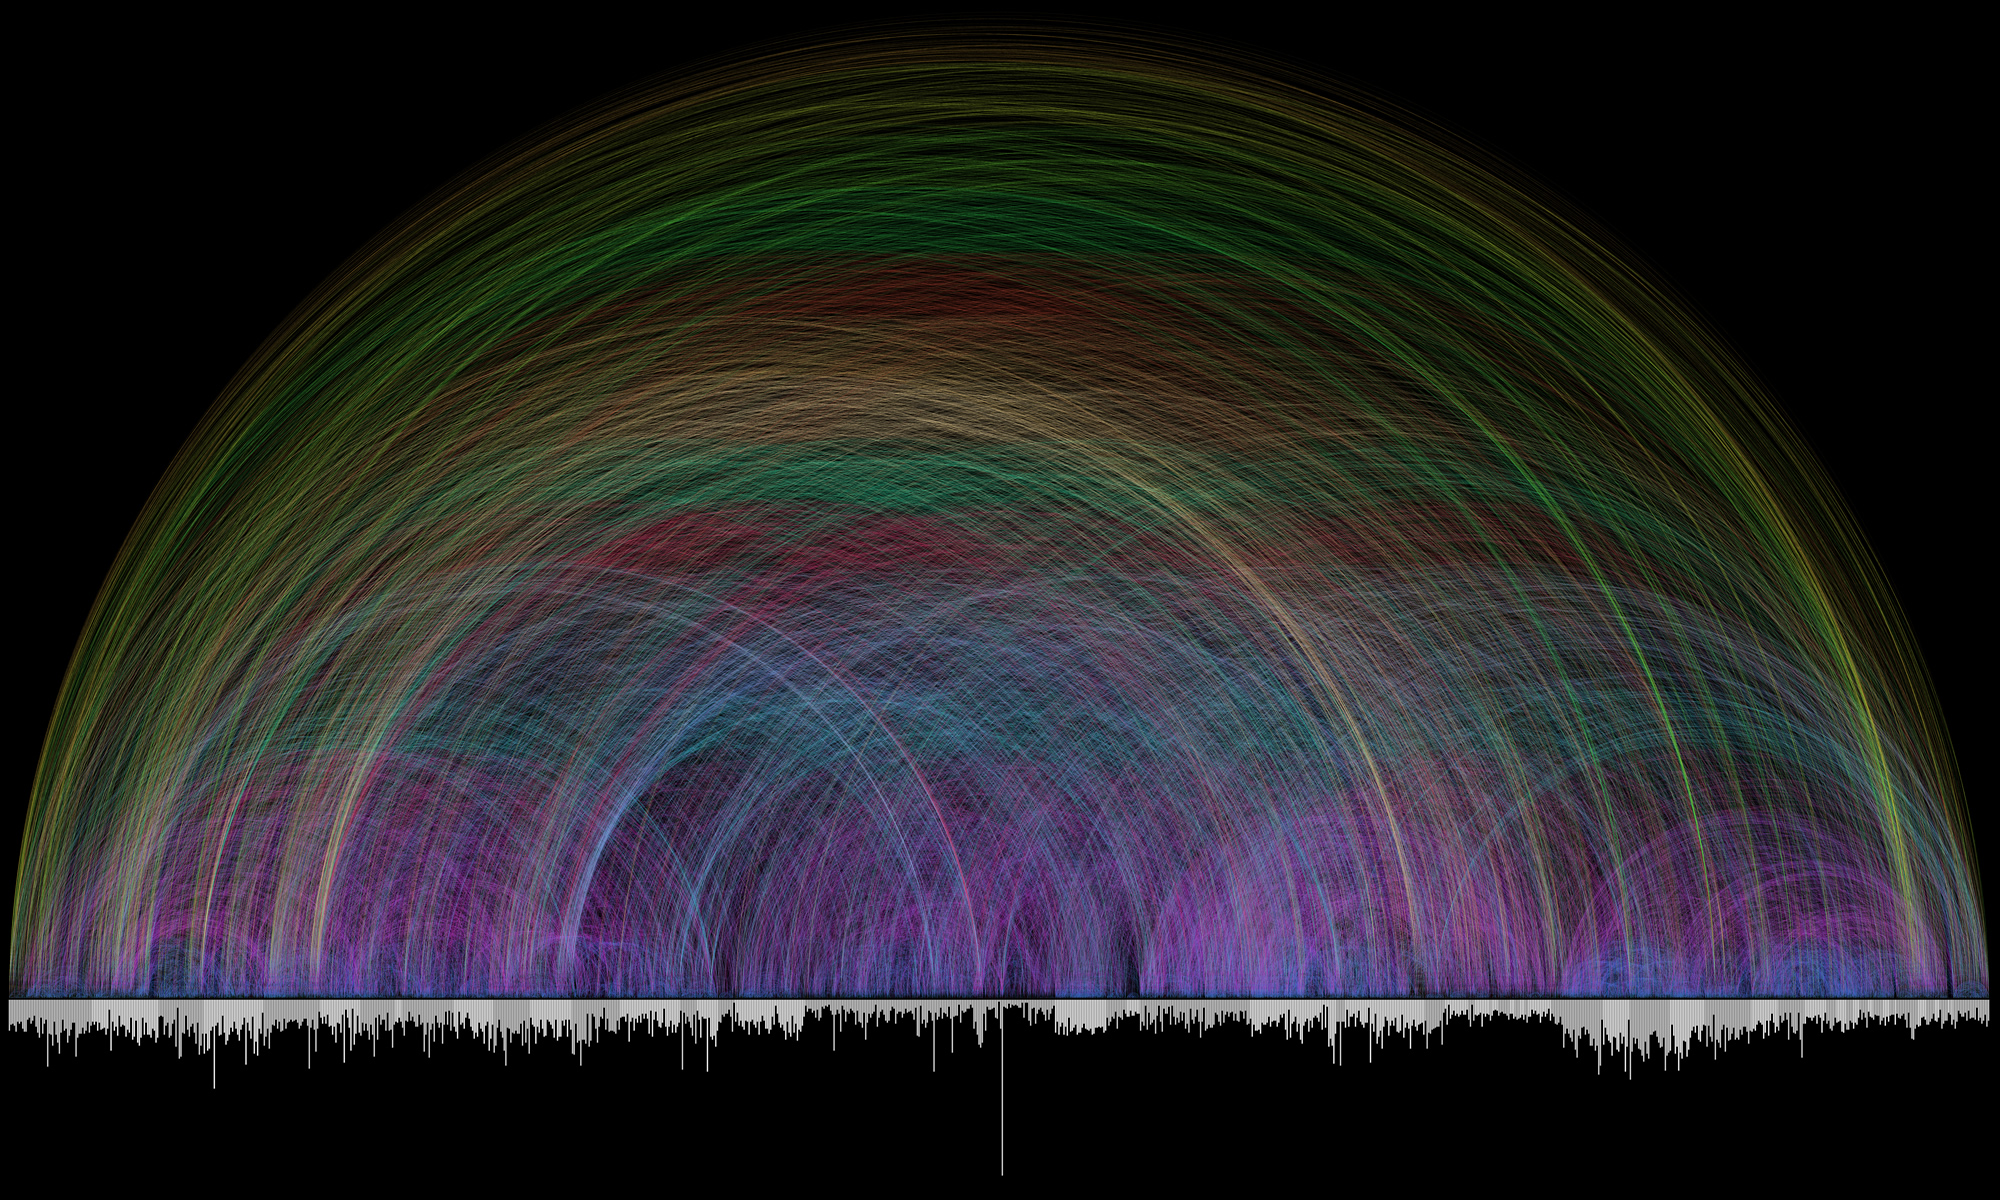
Another graphic by Chris Harrison attempts to create art from
the cross-references in the Bible.
Another site links TED videos into a network sphere that both
allows the user to navigate among the content and also visualize linkages.
 |
| http://well-formed.eigenfactor.org/radial.html |
The graphic below shows citation links between scholarly journals in a number of different fields. Some links make intuitive sense: gastroenterology and medical journals. In a couple of cases (psychology and economics), the lack of links to the rest of the scientific world seems suggestive about how these realms perceive each other. But, the power of the display is the non-intuitive links – why should there be a strong connection between geoscience journals and molecular biology ones?
 | |
|
The old saw is that a picture is worth a thousand words. But, as
the amount of data proliferates, we may need thousands of pictures. Or maybe
the picture needs to evolve.
No comments:
Post a Comment